Performance Update
Returns exclude dividends and transaction costs and assume a portfolio is fully invested and rebalanced when changes are made.
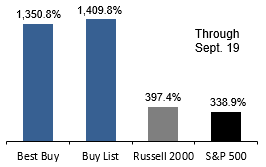
Strong Performance Since Inception In May 1999
Percentage gain since May 28, 1999 |
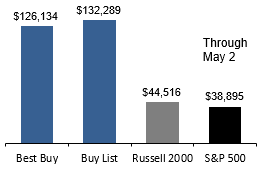
Value of $10,000 invested on May 28, 1999 |
 |
 |
By Calendar Year
|
|
Upside
Best Buy
List
(%)
|
Upside
Buy
List
(%)
|
Russell
2000
Index
(%)
|
S&P
500
Index
(%)
|
|
Total*
|
1,987.0
|
2,224.7
|
567.8
|
476.0 |
| Annualized Total* |
11.9 |
12.3 |
7.3 |
6.7 |
| |
|
|
|
|
| 2026 * |
16.8 |
21.5 |
21.9 |
9.6 |
| 2025 |
18.3 |
23.2 |
11.3 |
16.4 |
| 2024 |
26.1 |
30.3 |
10.0 |
23.3 |
| 2023 |
19.4 |
25.6 |
15.1 |
24.2 |
| 2022 |
(22.8) |
(25.1) |
(21.6) |
(19.4) |
| |
|
|
|
|
2021 |
53.3 |
42.9 |
13.7 |
26.9 |
|
2020
|
12.8
|
8.6
|
18.4
|
16.3
|
|
2019
|
39.7
|
32.3
|
23.7
|
28.9
|
|
2018
|
(35.4)
|
(31.2)
|
(12.2)
|
(6.2)
|
|
2017
|
12.5
|
19.9
|
13.1
|
19.4
|
| |
|
|
|
|
|
2016
|
6.5
|
9.0
|
19.5
|
9.5
|
|
2015
|
(4.6)
|
(8.8)
|
(5.7)
|
(0.7)
|
|
2014
|
1.8
|
7.7
|
3.5
|
11.4
|
|
2013
|
63.4
|
53.4
|
37.0
|
29.6
|
|
2012
|
9.8
|
11.6
|
14.6
|
13.4
|
| |
|
|
|
|
|
2011
|
(8.8)
|
(9.8)
|
(5.5)
|
0.0
|
|
2010
|
21.5
|
24.0
|
25.3
|
12.8
|
|
2009
|
27.5
|
32.7
|
25.2
|
23.5
|
|
2008
|
(44.7)
|
(47.5)
|
(34.8)
|
(38.5)
|
|
2007
|
0.5
|
4.5
|
(2.8)
|
3.5
|
| |
|
|
|
|
|
2006
|
18.6
|
18.2
|
17.0
|
13.6
|
|
2005
|
5.4
|
9.1
|
3.3
|
3.0
|
|
2004
|
38.3
|
46.8
|
17.0
|
9.0
|
|
2003
|
90.0
|
76.0
|
45.4
|
26.4
|
|
2002
|
(6.7)
|
(0.5)
|
(21.5)
|
(23.4)
|
| |
|
|
|
|
|
2001
|
1.2
|
(0.8)
|
1.0
|
(13.0)
|
|
2000
|
14.1
|
27.1
|
(4.2)
|
(10.1)
|
|
1999†
|
43.4
|
20.8
|
15.1
|
12.9
|
* Through June 30, 2026.
t May 28, 1999 to Dec. 31, 1999